Custom dashboards
Bespoke dashboards, built on your own data
Beyond asking questions in plain English, FactSmith builds dashboards made for one business: your feeds, your map, your targets. Six working examples below. The companies and every number are sample data, but each page is built the way FactSmith would build it on your data: operational feeds into one warehouse, one model, and answers people can act on.
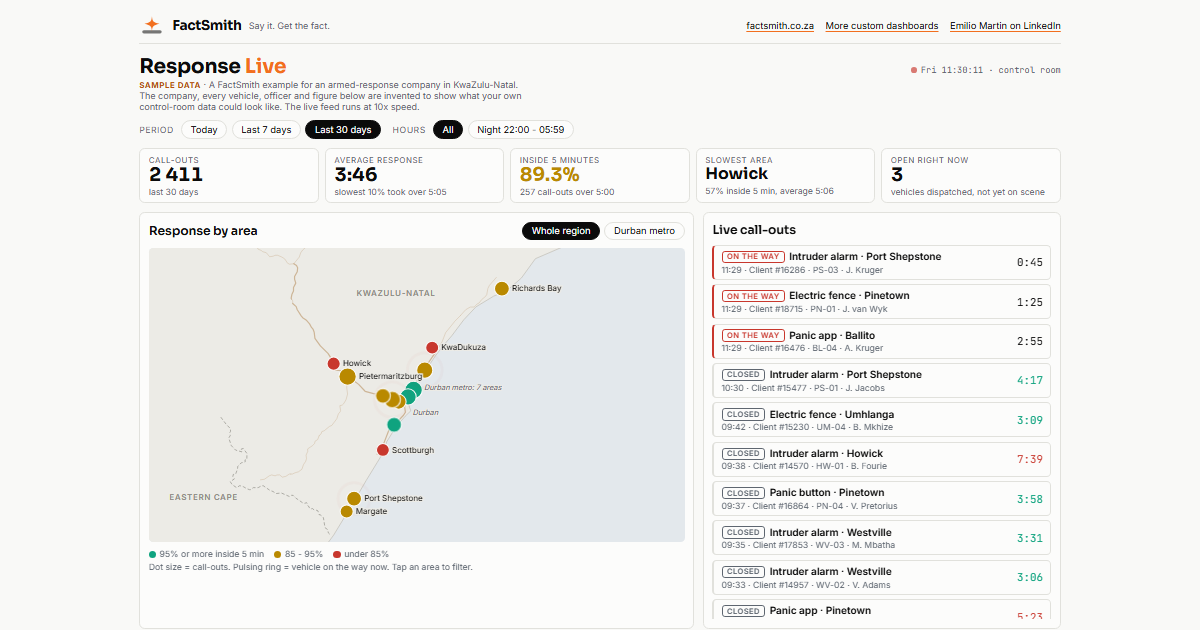
Response Live
Armed response. Response times by area against the 5-minute promise, live call-outs, worst hours, slow vehicles, and questions answered in plain English.
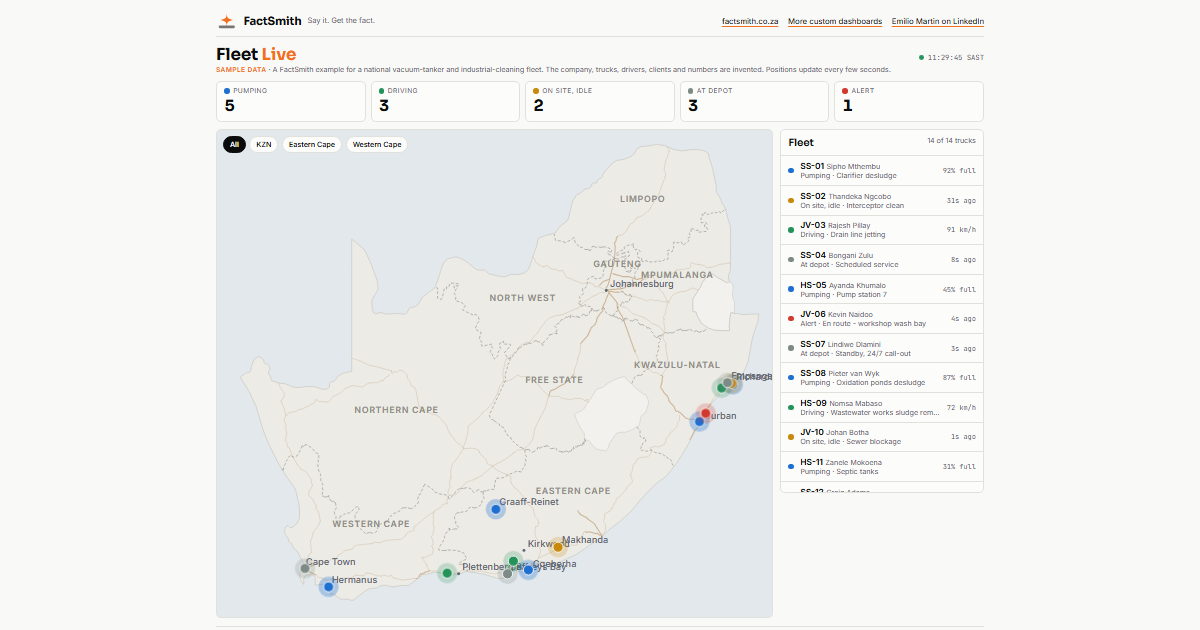
Fleet Live
Vacuum tankers and industrial cleaning. Every truck on one map: pumping, driving, idle or in trouble, with tank level, pump hours and fuel.
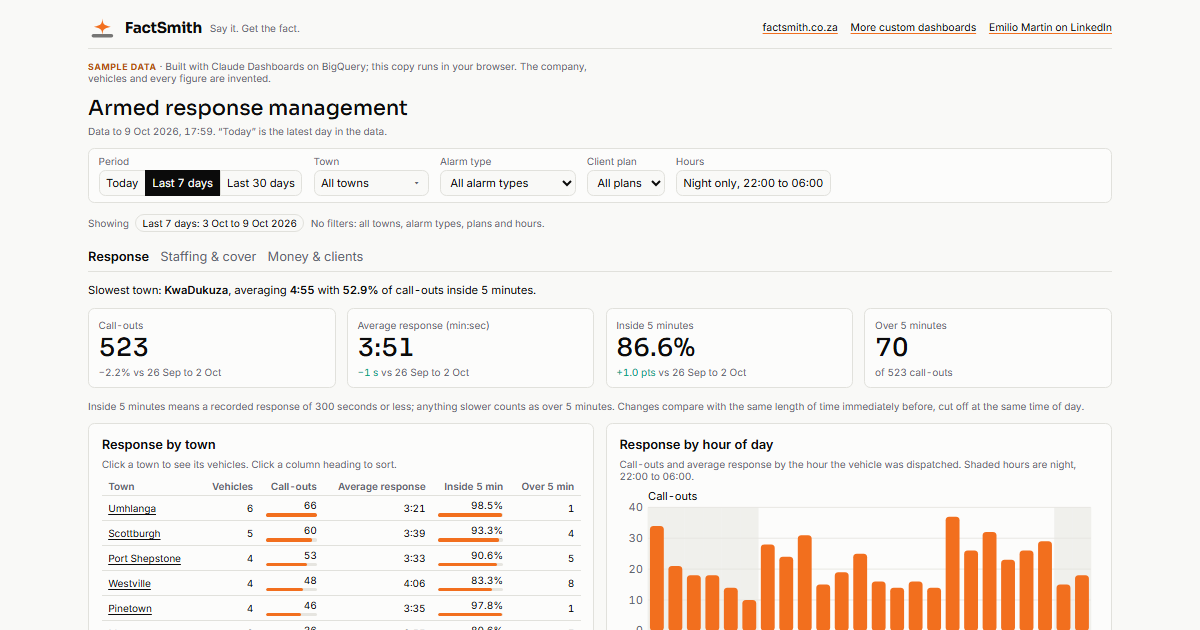
Armed Response Management
A Claude Dashboard on a Kimball model. Slicers by period, town, alarm type and plan, three tabs for response, staffing and money, and drill-down from town to vehicle.
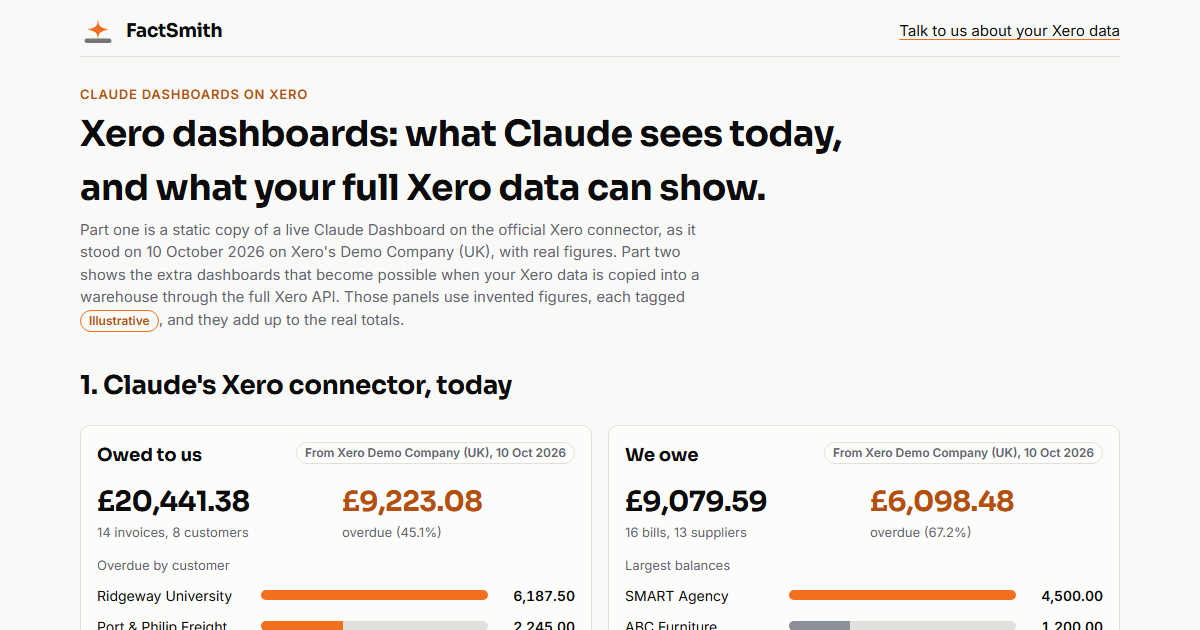
Xero dashboards
What Claude's Xero connector shows today: who owes you, who you owe, profit and cash. Then nine more dashboards the full Xero API can feed, clearly tagged as illustrative.
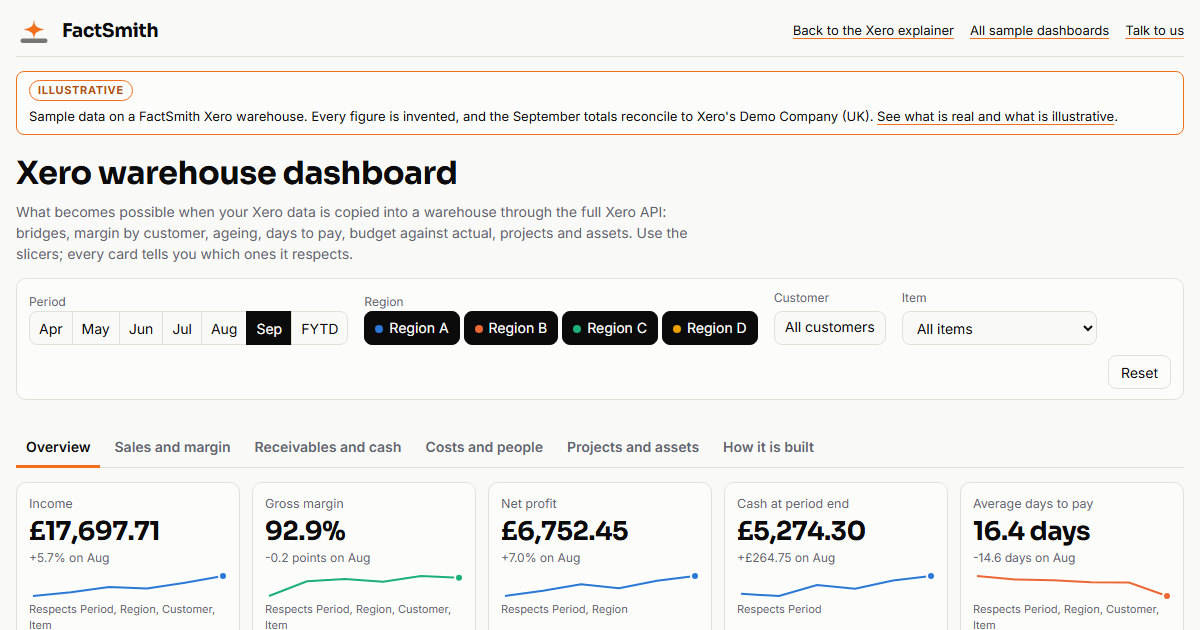
Xero warehouse (full dashboard)
The full Xero API in a FactSmith warehouse. Slicers by period, region, customer and item, with tabs for sales and margin, receivables and cash, costs and people, and projects and assets. Sample data.
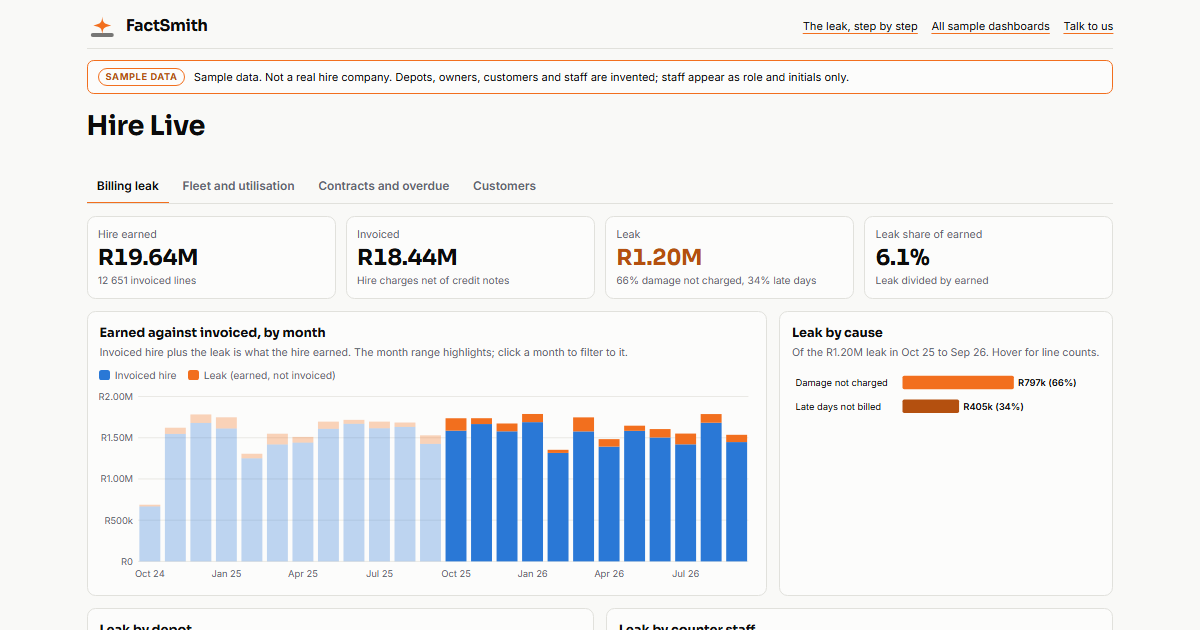
Hire Live
An interactive equipment hire dashboard on sample data. Four tabs: billing leak, fleet and utilisation, contracts and overdue, customers. Slicers for franchisee, depot, category, customer segment and month range, with click-to-filter on every chart.
Sample data only. factsmith.co.za · hello@factsmith.co.za