Insights
The dashboard found the R3.6M. Claude built the collections tracker.
Use each tool for what it is good at. One shows where the money went. The other does the next job.
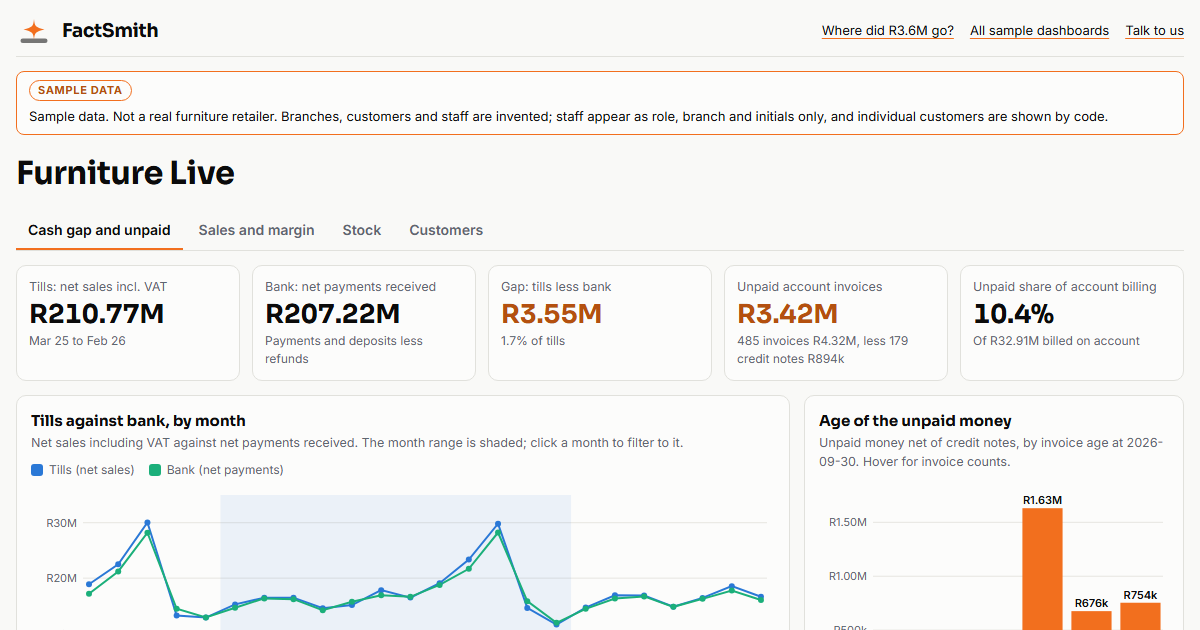
What's here. This article tells the whole story: where the money went, then what to do about it. Furniture Live is the dashboard behind the first half, to try yourself. The 68-second movie below is Claude, on the same data, doing the second half.
Take a furniture and bedding retailer with eight stores. In its last financial year the tills rang up R210.8M. The bank received R207.2M. The gap, R3.6M, is only 1.7% of sales, but nearly all of it has one cause: R3.42M of invoices on account that nobody has paid.
We built two things on the same warehouse to chase it. A dashboard, and a conversation with Claude. They are good at different things, and the useful part is seeing which is which.
The dashboard: where
Furniture Live is the interactive dashboard: four tabs (cash gap and unpaid, sales and margin, stock, customers) and five slicers (period, branch, customer segment, channel, product category). Click Gateway Durban and every chart follows; click the salesperson who tops the list and you are down to that person's invoices and customers.
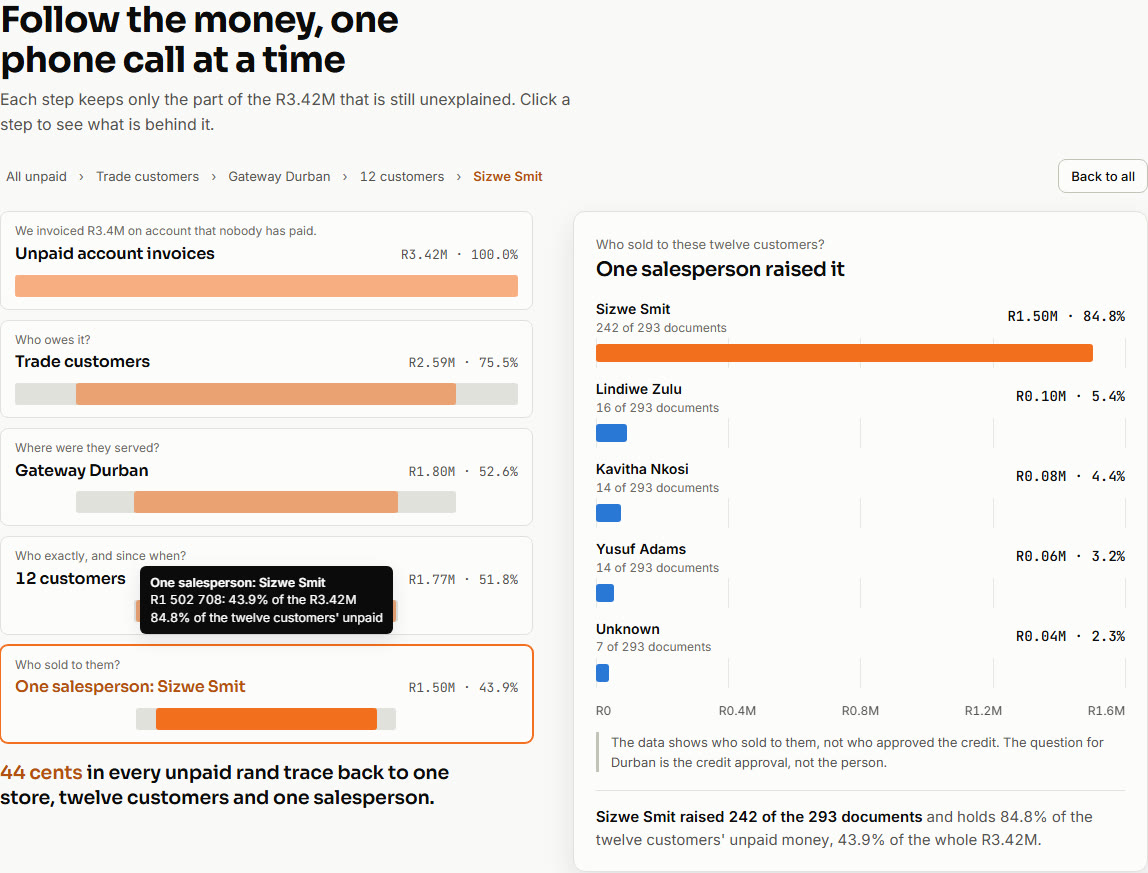
Followed one click at a time, the R3.6M comes down to a handful of phone calls:
Where did it go?
R3.42M of the R3.6M gap, 96%, is invoices on account that nobody has paid.Who owes it?
Trade customers: guest lodges, interiors firms, property groups. R2.59M, three quarters of the unpaid money. 13.5% of what trade customers were billed is unpaid, against 5 to 7% for everyone else.Where were they served?
One store, Gateway Durban: R1.80M, seven in ten unpaid trade rands. 39.7% of what Durban billed to trade customers is unpaid, against 4 to 8% at every other store.Who exactly?
Twelve customers there hold R1.77M, 98.5% of Durban's unpaid trade money.Who sold to them?
One salesperson raised R1.50M of it, 84.8%. The data shows who sold to them, not who approved their credit.
Forty-four cents of every unpaid rand traces back to that one store, those twelve customers and that one salesperson.
That is what a dashboard is for: fixed definitions, checked once, the same numbers for everyone. What it cannot do is the next thing. It has no chart for which invoices do I phone about first?
Claude: what next
So we opened Claude, connected it to the same data in BigQuery, and asked plain questions, one after another. One take, no rehearsed answers. The captions in the movie follow what it said.
Are we collecting everything we sell?
Claude chose two years, not one. Over that window R9.74M of sales never reached the bank, and R11.6M of invoices were never paid.Who owes it?
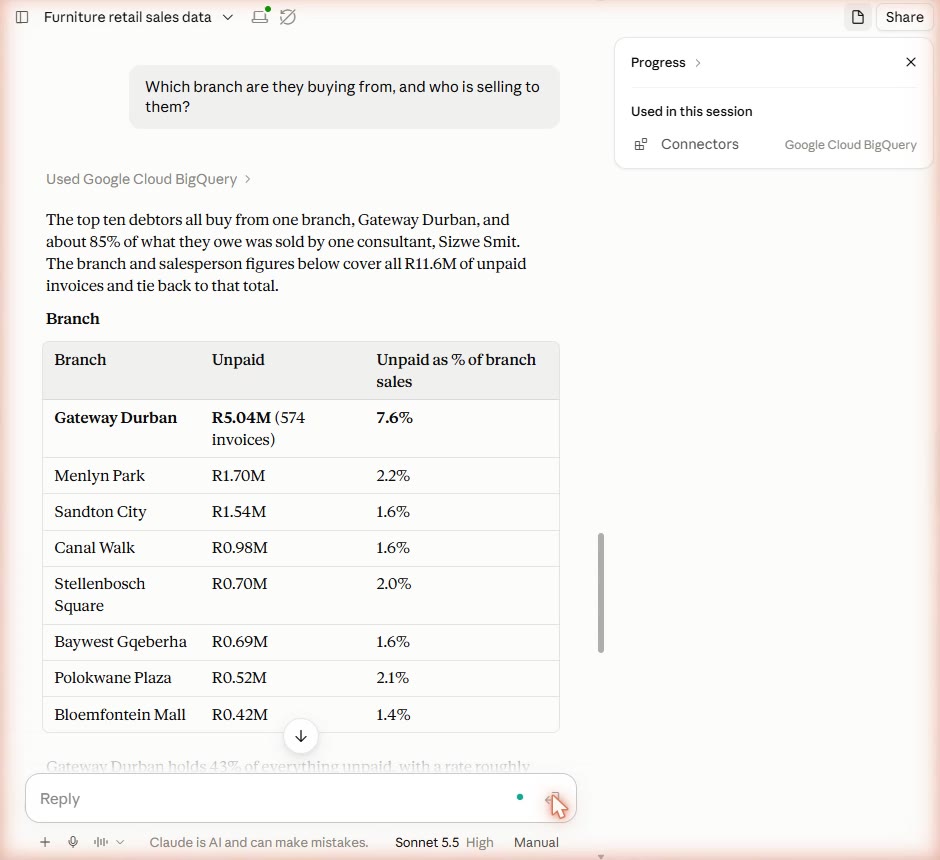
490 customers. The top ten owe R3.47M, and all ten are trade customers.Which branch are they buying from, and who is selling to them?
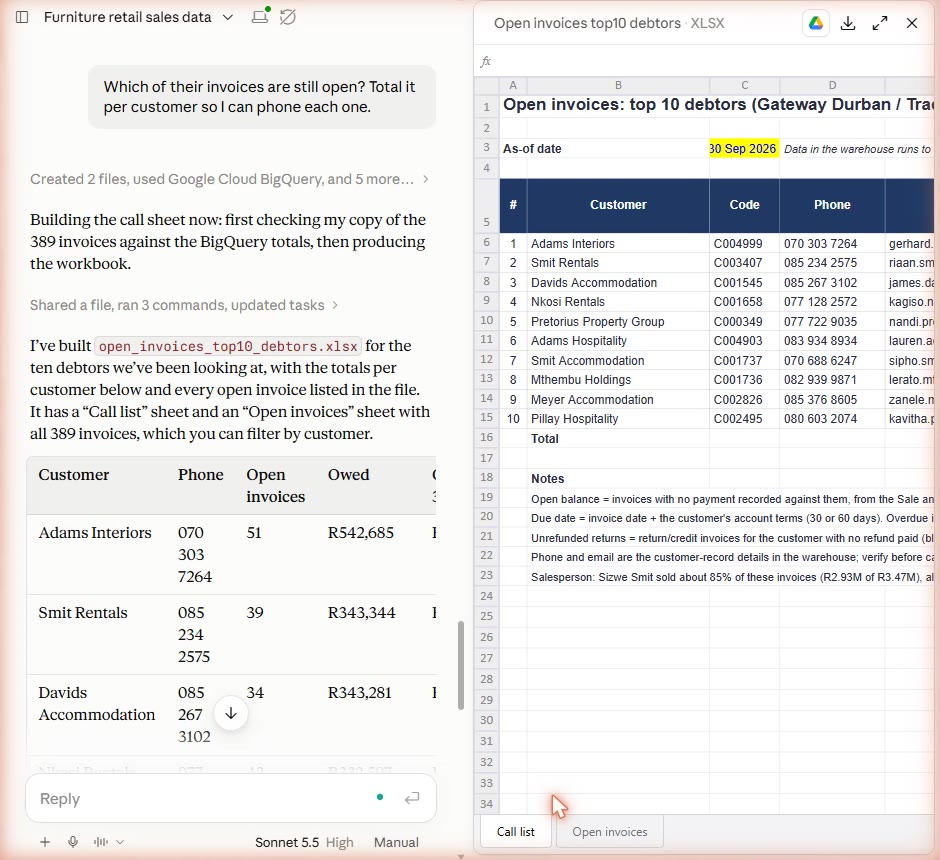
Gateway Durban holds 43% of everything unpaid. One consultant sold about 85% of what the top ten owe. Claude said why is not in the data: it is a question for credit control and the branch manager.Which of their invoices are still open? Total it per customer so I can phone each one.
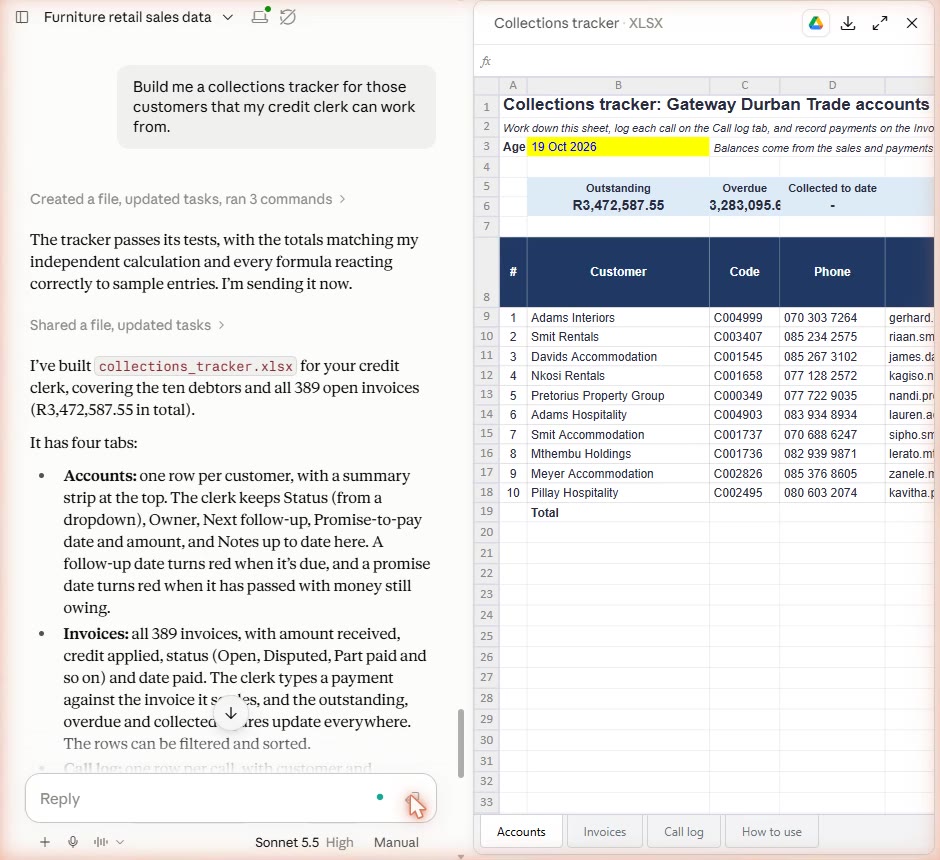
A spreadsheet: 389 open invoices, one row per customer, sorted by amount, with phone numbers.Write a short note to that branch manager.
A short note to the Durban manager, drafted and ready to open in Mail.Build me a collections tracker for those customers that my credit clerk can work from.
A workbook with four tabs: accounts, invoices, a call log and how to use it. R3,472,587.55 open.Is our trade counter worth it once discounts and unpaid accounts are counted?
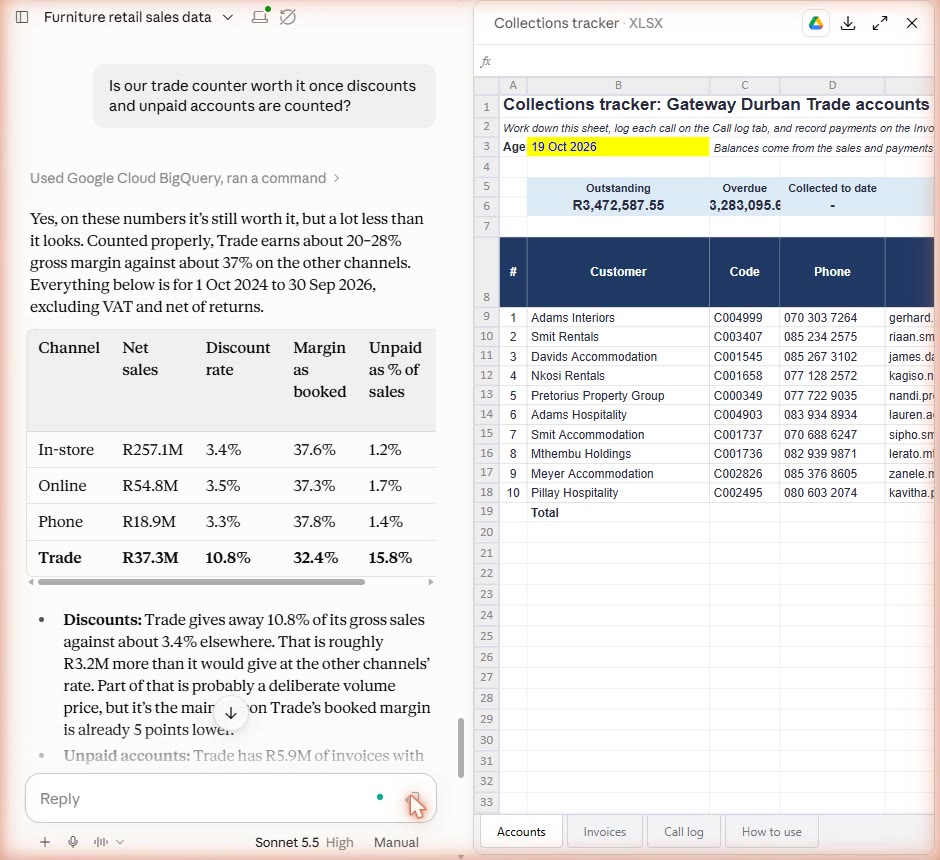
Yes, but about half as much as it looks. Trade gives away 10.8% in discounts against about 3.4% elsewhere, and books a 32.4% margin. Count the unpaid as lost and that margin falls to about 20%.
Side by side
The dashboard
- The same answer every time, from definitions checked once
- Opens instantly, and anyone can read it
- Shows where the money went
- Stops at the questions it was built for
Claude on the same data
- Takes the next question in plain words
- Builds the thing you need: a list, a note, a tracker
- Chooses its own definitions, so read what it says it did
- Each answer takes a minute or two, not a second
Where they disagree
The two headline numbers are different, and that is worth knowing. The dashboard counts one financial year, March 2025 to February 2026: R3.6M. Claude, asked are we collecting everything?
, chose its own window, the last two years of data, and found R9.74M. Neither is wrong. They answer the question over different periods, and only one of them tells you so on the front page.
Where they overlap, they agree: the same store, the same trade customers, the same salesperson, the same caution about why. That is because both read one modelled warehouse, with the same customers, invoices and payments underneath. The dashboard pins the definition. Claude moves fast but picks its own. Use the first to know where to look, and the second to do something about it.
The part that makes both work
Neither tool works on raw till exports. Both need the sales, invoices, payments and customers joined up and named the same way, once. That is the work we do: get the data organised, then let you just ask.
Want to see this on your own numbers? Book a 20-minute data check, or open Furniture Live and filter it to Gateway Durban yourself.
Sample data: a generated furniture retail warehouse, not a real company. The chat ran in Claude (Sonnet 5.5) with Memory off, on 19 October 2026. The same pattern for a hire business · More insights · factsmith.co.za · emilio@factsmith.co.za